 A la découverte des (Hyper)complexes,
des fractales ET de la théorie du Chaos
Sont-ils présents dans notre monde ?
A la découverte des (Hyper)complexes,
des fractales ET de la théorie du Chaos
Sont-ils présents dans notre monde ?

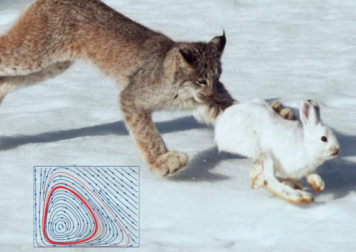
Le modèle proie-prédateur de Lotka-Volterra implémenté en Python
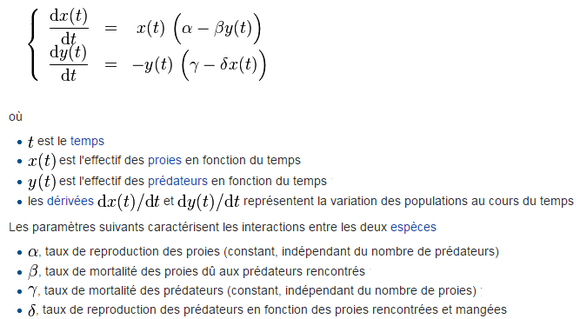
Présentation du système différentiel à approximer par la méthode d'Euler pour les équations différentielles
Codage en Python
import
numpy as np
import
matplotlib.pyplot as plt
a,b,c,d=1.5,0.05,0.48,0.05
'''a=taux de reproduction des proies (constant, indépendant du nombre de prédateurs)
b=taux de mortalité des proies dû aux prédateurs rencontrés
c=taux de mortalité des prédateurs (constant, indépendant du nombre de proies)
d=taux de reproduction des prédateurs en fonction des proies rencontrées et mangées'''
def
lapin(l,y):
return
a*l-b*l*y
def
lynx(l,y):
return
-c*y+d*l*y
def
Lotka_Volterra(l_0,y_0,tmin,tmax,h):
liste_t=[0]
liste_l=[l_0]
liste_y=[y_0]
t=tmin
dy=y_0
dl=l_0
while
t<=tmax:
t+=h
liste_t.append(t)
dl+=lapin(dl,dy)*h
dy+=lynx(dl,dy)*h
liste_l.append(dl)
liste_y.append(dy)
return
liste_t,liste_l,liste_y
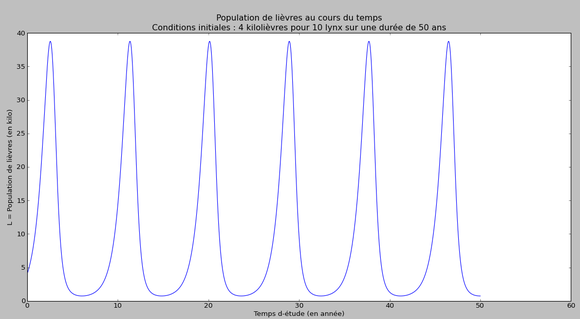
'''Population de lièvres en fonction du temps'''
def
affichage_Lotka_Volterra_TL(l_0,y_0,tmin,tmax,h):
T,L,Y=Lotka_Volterra(l_0,y_0,tmin,tmax,h)
plt.plot(T,L)
plt.title('Population
de lièvres au cours du temps\nConditions initiales : 4 kilolièvres pour 10 lynx sur une durée de 50 ans')
plt.xlabel('Temps
d-étude (en année)')
plt.ylabel('L
= Population de lièvres (en kilo)')
plt.show()
#affichage_Lotka_Volterra_TL(4,10,0,50,0.0005)
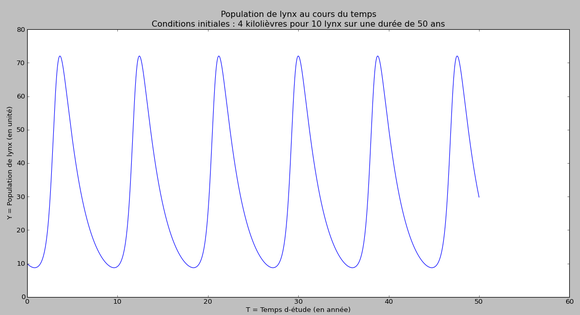
'''Population de lynx en fonction du temps'''
def
affichage_Lotka_Volterra_TY(l_0,y_0,tmin,tmax,h):
T,L,Y=Lotka_Volterra(l_0,y_0,tmin,tmax,h)
plt.plot(T,Y)
plt.title('Population
de lynx au cours du temps\nConditions initiales : 4 kilolièvres pour 10 lynx sur une durée de 50 ans')
plt.xlabel('T
= Temps d-étude (en année)')
plt.ylabel('Y
= Population de lynx (en unité)')
plt.show()
#affichage_Lotka_Volterra_TY(4,10,0,50,0.0005)
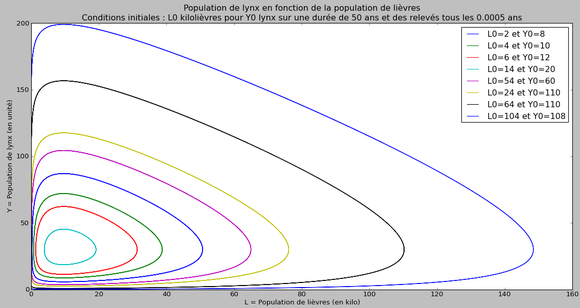
'''Population de lynx en fonction de la population de lièvres'''
def
affichage_Lotka_Volterra_YL(l_0,y_0,tmin,tmax,h):
T,L,Y=Lotka_Volterra(l_0-2,y_0-2,tmin,tmax,h)
plt.plot(L,Y,
label="L0=2
et Y0=8")
T,L,Y=Lotka_Volterra(l_0,y_0,tmin,tmax,h)
plt.plot(L,Y,
label="L0=4
et Y0=10")
T,L,Y=Lotka_Volterra(l_0+2,y_0+2,tmin,tmax,h)
plt.plot(L,Y,
label="L0=6
et Y0=12")
T,L,Y=Lotka_Volterra(l_0+10,y_0+10,tmin,tmax,h)
plt.plot(L,Y,
label="L0=14
et Y0=20")
T,L,Y=Lotka_Volterra(l_0+50,y_0+50,tmin,tmax,h)
plt.plot(L,Y,
label="L0=54
et Y0=60")
T,L,Y=Lotka_Volterra(l_0+20,y_0+100,tmin,tmax,h)
plt.plot(L,Y,
label="L0=24
et Y0=110")
T,L,Y=Lotka_Volterra(l_0+60,y_0+100,tmin,tmax,h)
plt.plot(L,Y,
label="L0=64
et Y0=110")
T,L,Y=Lotka_Volterra(l_0+100,y_0+100,tmin,tmax,h)
plt.plot(L,Y,
label="L0=104
et Y0=108")
plt.title('Population
de lynx en fonction de la population de lièvres\nConditions initiales : L0 kilolièvres pour Y0 lynx sur une durée de 50 ans et des relevés tous les 0.0005 ans')
plt.xlabel('L
= Population de lièvres (en kilo)')
plt.ylabel('Y
= Population de lynx (en unité)')
plt.legend(loc="upper
right")#localisation
de l'affichage de la légende sur le graphique
plt.show()
#affichage_Lotka_Volterra_YL(4,10,0,50,0.0005)
Résultats des tracés
Population de lièvres en fonction du temps
Population de lynx en fonction du temps
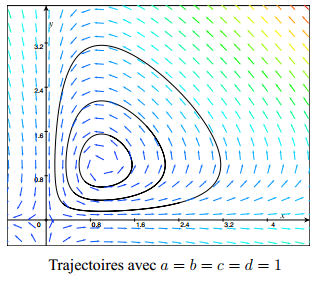
Population de lynx en fonction de la population de lièvres
Visualisation du gradient (couleurs) et du rotationnel (vecteurs)
Horloge

Donnez votre avis

Moy. 5/5(15 votes)
Contact
Site réalisé par
Allan ROSS
(2013)
@Fractales67
